
Hurricanes and the Saffir-Simpson Scale
Hurricanes, cyclones, and typhoons are the same meteorological phenomenon: a storm system characterized by a closed circulation around a low-pressure center that produces strong winds and heavy rain. Scientists call these storms differently depending on where they occur. When a storm forms in the North Atlantic, the Caribbean, or the Northeast Pacific, it is called a hurricane. In the Northwest Pacific, it is called a typhoon. If it occurs in the Southeast Indian Ocean or the Southwest Pacific, it is called a tropical cyclone.
Hurricanes can be classified into categories according to the Saffir-Simpson scale. The scale was developed in 1969 and introduced to the general public in 1973. It is a five-level scale based on wind speed that describes the potential damage to buildings. Neither the amount of precipitation nor the location is taken into account, meaning that a Category 3 hurricane affecting a large city may cause much more damage than a Category 5 hurricane affecting an unpopulated area.
The five intensity categories are as follows. Category 1 (119 to 153 km/h, or 74 to 95 mph) causes no damage to building structures. Category 2 (154 to 177 km/h, or 96 to 110 mph) causes damage to roofs, doors, and windows. Category 3 (178 to 209 km/h, or 111 to 130 mph) causes structural damage to small buildings. Category 4 (210 to 250 km/h, or 131 to 155 mph) causes widespread damage to protective structures, collapse of roofs on small buildings, and flooding of inland areas. Category 5 (251+ km/h, or 157+ mph) can tear trees and even homes from their foundations, and mass evacuation may be required. One of the most famous hurricanes was Hurricane Katrina in 2005, which reached Category 5 intensity.
Earthquakes and the Richter Scale
An earthquake, also called a tremor or seismic event, is a sudden and temporary shaking of the earth’s crust. The most common ones are caused by the activity of geological faults. The point of origin of an earthquake is called the focus or hypocenter, from where it propagates in the form of seismic waves. The point on the earth’s surface closest to the hypocenter, where seismic waves reach first, is called the epicenter.
Depending on its magnitude and origin, an earthquake can cause displacements of the earth’s crust, landslides, tsunamis, or volcanic activity.
Various scales are used to measure the energy released by an earthquake, including the Richter scale, which is the most well-known and commonly referenced by the media. The Richter scale, also known as the local magnitude scale, is a logarithmic scale that assigns a number to quantify the energy released by an earthquake. Seismology uses this scale to determine the strength of earthquakes with a magnitude between 2.0 and 6.9.
On a seismogram, the P (primary) waves are recorded before the S (secondary) waves. The time elapsed between both instances is Δt. This value and the maximum amplitude A of the S waves allowed Charles Francis Richter to calculate the magnitude of an earthquake as M_L = log(A · Δt³ / 1.62), where A is the amplitude of the waves in millimeters taken directly from the seismogram, Δt is the time in seconds from the beginning of the P waves to that of the S waves, and M_L is the local magnitude.
The Moment Magnitude Scale
At the beginning of the 21st century, traditional magnitude scales such as M_L were considered obsolete by most seismologists, being replaced by a more physically meaningful measure called the moment magnitude scale, M_W. Although the media often confuses scales when reporting on seismic events, it is considered incorrect to say that an earthquake was of magnitude greater than 7.0 “on the Richter scale,” since earthquakes with a magnitude greater than 6.9 have been measured since 1978 with the moment magnitude scale, as the latter better discriminates extreme values.
An advantage of the moment magnitude scale is that it does not saturate near high values. Unlike other scales, it does not have a value above which all the largest earthquakes reflect very similar magnitudes. Another advantage is that it coincides and continues with the parameters of the Richter scale. For these reasons, the moment magnitude scale is the most commonly used by seismologists to measure and compare large earthquakes.
The moment magnitude is defined as M_W = (2/3) log(M₀) − 10.7, where M₀ is the seismic moment. M₀ is a quantity that combines the rupture area and fault offset with a measure of rock strength: M₀ = μ · A · ε, where μ is the shear modulus of the rocks involved in the earthquake, A is the rupture area along the geological fault where the earthquake occurred, and ε is the average displacement of A.
The largest release of energy ever measured was during the earthquake in the city of Valdivia, Chile, on May 22, 1960, which reached a moment magnitude of 9.5.
Tsunamis and the Imamura-Iida Scale
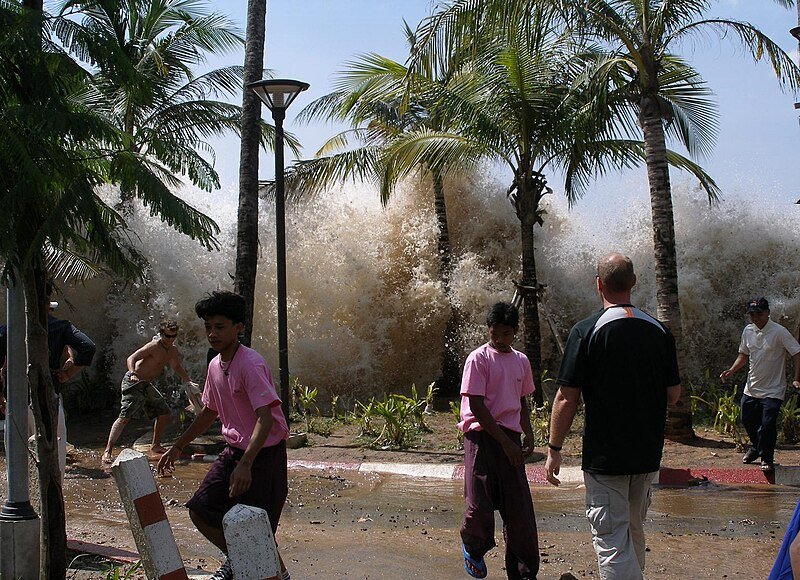
A tsunami, also called a tidal wave, is a complex event involving a group of waves in a body of water with great energy and variable size that occurs when a large mass of water is displaced vertically by some extraordinary phenomenon, such as earthquakes, volcanic eruptions, underwater nuclear detonations, landslides, or meteorite impacts. Unlike normal ocean waves produced by wind, or tides generated by the gravitational attraction of the sun and moon, a tsunami is generated by the displacement of water. It is estimated that 75% of tsunamis are caused by earthquakes.
Due to the Ring of Fire, the most active earthquake zone on the planet, the Pacific Ocean is the place most affected by tsunamis. Japan in particular is the country most affected due to its geographical location.
The energy of a tsunami depends on its height, its wavelength, and the length of its front. The Imamura-Iida scale is a graded scale that measures the intensity of tsunamis. Proposed in 1970, it ranges from 0 to 4, with each grade implying different levels of damage. Grade 0: the maximum flood level is 1 to 1.5 m and does not cause damage. Grade 1: houses are flooded and boats are destroyed. Grade 2: human deaths occur, and houses and boats are destroyed. Grade 3: damage extends along 400 km of coastline. Grade 4: damage extends along 500 km of coastline.
The deadliest tsunami in history occurred in the Indian Ocean on December 26, 2004. This tsunami was triggered by a magnitude 9.3 earthquake that generated waves up to 30 m high.
Tornadoes and the Fujita-Pearson Scale
A tornado is a column of air with high angular velocity whose lower end is in contact with the earth and whose upper end connects with a cumulonimbus cloud. Cumulonimbus clouds are clouds of great vertical development, internally formed by a column of warm, humid air that rises in the form of a rotating spiral. The tornado is the most energetically dense atmospheric cyclonic phenomenon on Earth, although it is of small extension and short duration (from seconds to more than an hour).
The Fujita-Pearson scale is a scale for measuring and classifying the intensity of a tornado. It is based on the destruction caused to man-made structures and vegetation. Developed in 1971, it is the most universally accepted tornado intensity scale. This scale is not based on the size, diameter, or speed of the tornado, but on the damage caused by it.
Most tornadoes occur in the central and eastern United States in the area known as Tornado Alley. This colloquial term designates a large area of the country where the best conditions for tornado formation are found, spanning areas of Texas, Louisiana, Oklahoma, Kansas, South Dakota, Iowa, and Nebraska. The Great Plains area is relatively flat, and this allows the cold polar air of Canada to meet the warm tropical air of the Gulf of Mexico. When these two air masses meet, most of the most powerful tornadoes form.
The 2011 Joplin, Missouri tornado was part of the May 2011 United States tornado outbreak, classified as EF5, and caused 158 direct deaths.
Volcanic Eruptions and the VEI
A volcanic eruption is a geological phenomenon characterized by the violent emission onto the earth’s surface by a volcano of lava, tephra, ash, lapilli, volcanic bombs, and volcanic blocks, accompanied by volcanic gases.
There are three different types of eruptions. The most commonly observed are magmatic eruptions, which involve the decompression of gas within magma that propels it outward. Phreatomagmatic eruptions are another type, caused by the interaction between magma and water. The third eruptive type is the phreatic eruption, which is driven by the superheating of steam on contact with magma. Phreatic eruptions often do not show magmatic release but instead cause granulation of existing rock.
The Volcanic Explosivity Index (VEI) is a scale from 0 to 8 for measuring the strength of volcanic eruptions. It works in a similar way to the Richter scale for earthquakes, as each interval represents a tenfold increase in magnitude. It is a logarithmic scale. The vast majority of volcanic eruptions have a VEI between 0 and 2. The VEI records how much volcanic material is ejected, the height of the eruption column, and how long it lasts. An increase of 1 indicates an eruption 10 times more powerful. An increase of 2 is 100 times more powerful.
The 1980 eruption of Mount St. Helens was one of the most catastrophic volcanic eruptions of the 20th century, with a VEI of 5. The explosion was the largest of all those that occurred in the United States.
The Role of Mathematical Models
Natural disasters cannot always be avoided, but their effects can be reduced. Mathematical models are tools that allow us to analyze and predict natural phenomena. They are used to study the relationship between variables and understand how nature behaves. Every scale discussed here, from the Saffir-Simpson to the VEI, is built on mathematical relationships, whether logarithmic, linear, or empirical. These models give scientists and emergency planners the quantitative language they need to assess risk, issue warnings, and allocate resources before disaster strikes.
Further Reading
- Saffir-Simpson Hurricane Wind Scale at the National Hurricane Center
- Earthquake Magnitude, Energy Release, and Shaking Intensity at the USGS
- Moment Magnitude Scale on Wikipedia
- Volcanic Explosivity Index on Wikipedia
- Enhanced Fujita Scale at the Storm Prediction Center
Leave a Reply